Falling in love with your community can be easy; doing the hard work of really getting to know it can take more effort. Here’s another free tool to help you learn your community: school boundary maps.
One of the challenges of demographics research is cutting through the averages. Your report says that the average income is $x in your town, but we all know that each neighborhood is higher or lower than that. How do you start figuring out which is which so you can understand their needs better?
My simple supposition is this: each school’s population ultimately reflects the neighborhoods it serves. Learn about the school and you get at least a beginner’s insight into its surrounding community.
School Boundary Maps
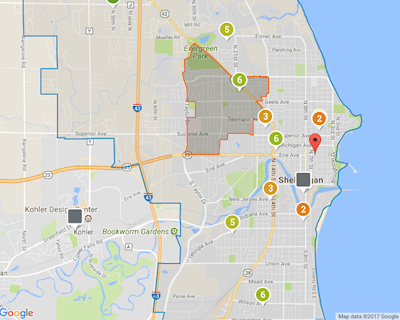
Great!Schools.org provides you an interactive map where you can investigate where each school’s boundaries fall, like this one in Sheboygan:
You can refer back to these maps or even create a new layer on your custom target area map and rough in the boundaries to have them all in one place.
School Boundary Demographics
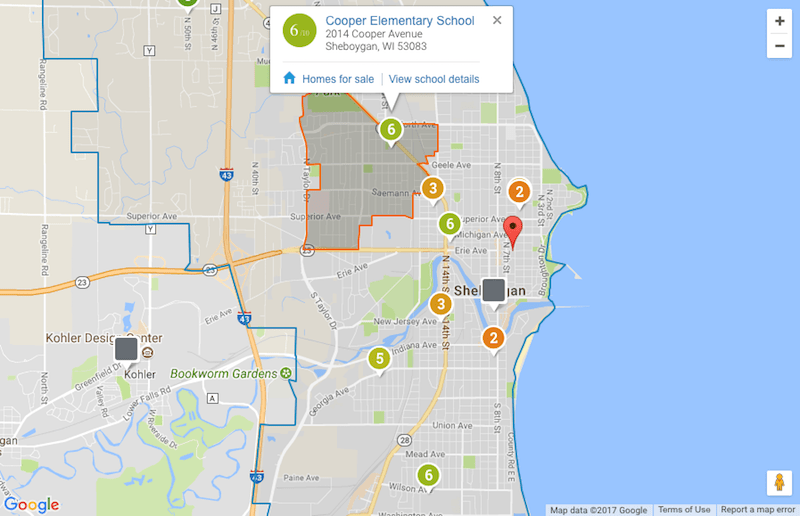
But the researchy goodness doesn’t stop there! You can click through on each school and get some vital stats, like:
- test scores
- student progress (are scores getting better over time?)
- race/ethnicity
- low-income students
- contact information
Use the contact information and network with the principal or a counselor about what you’re learning and what opportunities they see. What a great way to speed through your learning curve and get to serving real needs!
Gerrymandered School Boundaries
In my research for this post, I quickly stumbled upon debate about inequities in school boundaries (AKA catchment areas). Whether or not this is on your radar, it should be. It’s a system in need of reform. School boundaries can both reflect racial segregation that already exists in a community as well as feed that segregation.
Some catchment areas are gerrymandered as bad as any congressional district. I found articles that argued gerrymandering has been a tool of segregation. Another article showed research that the most gerrymandered catchment areas were actually the most diverse, which suggests that it has been used as a tool of desegregation. It’s complicated, to be sure, but this map of school district poverty is telling.
We parents can be a little crazy about our kids. If you’re in a community that is drawing or redrawing school boundary maps, that may spark conflict that reveals ancient strongholds, rivalries, or deeply-held values that no one will say out loud. What a great opportunity to learn and to share the love of Christ.
As a missionary to your community, understanding the various neighborhoods can be an important tool toward making a difference where you live. Use these school boundary maps to help.