This is an update to my post about free soft demographic reports from July 2012.
Experian, whom you may know as one of the big three credit bureaus, has been amassing both hard & soft demographic data for years that gives them (and now you) insight into people in your area. They’ve carved up American society into 71 neat ‘MOSAIC’ segments, or subcultures.
Hard demographics include the typical measures: age, race, income, etc. Soft demographics are a little fuzzier and include things like:
- what sports they follow
- how ‘green’ they are
- how they view the world
- how quickly they adopt new technologies
Get Free Soft Demographic Reports
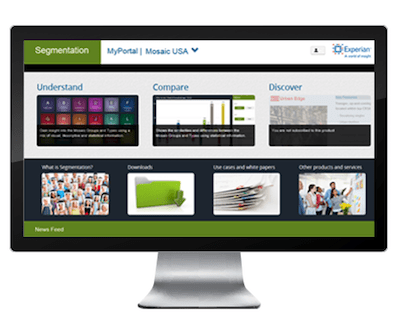
Go to the Experian MOSAIC Segmentation website and fill in your contact information in their Gain Access Now box. Within a day or two, they will email you a username and password for access to their system.
Once you receive that, you can return to the site and log in to pull your own free soft demographic reports:
- Select Understanding Your Segments
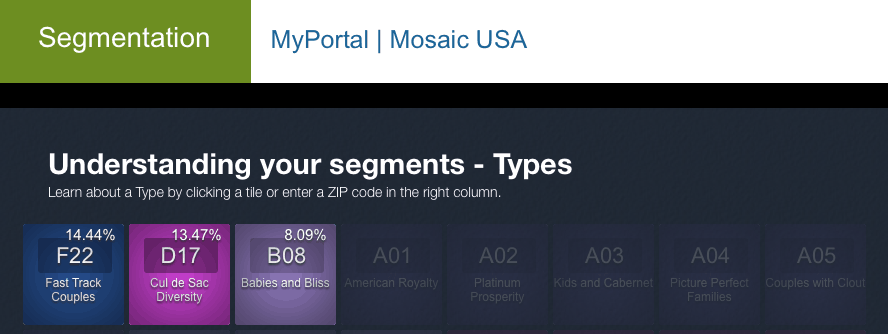
- In the right-hand column, click the Types button
- Type your 5-digit zip into the zip code box and press enter
- Experian will show you to the top 3 Mosaic profiles, with their percentages, in your zip code (see image above)
- Click into each profile and fasten your seat belt!
- The cover page shows you images of stereotypical people from that group in front of the stereotypical home
- It also offers some basic hard demographics: age, income, household size, and a few others
- Click on the bar graph in the lower left-hand corner and learn through each of the various insights
Understanding The Line Graphs
Each data point will show you several horizontal bar graphs:
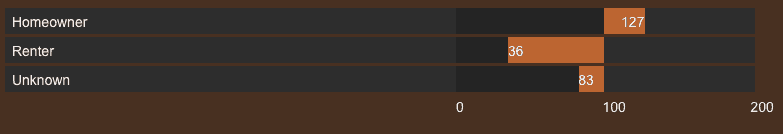
Here’s what you’re seeing:
- The “100” line down the middle is the overall US average for each ‘answer’
- Bars that extend to the right indicate items where this group is higher than the national average
- Bars that extend to the left indicate items where this group is below the national average
- The number on each bar gives you its value so you can see how much more or less it is
Free soft demographic reports will help you understand your community better and perhaps even give you insights into what kinds of needs your church plant can help address.
Leave a Reply